


TGIF!
THICC RETURN: +$0
If you're curious about what I trade & how I trade, join the Goonie Trading Discord. You can be a premium member for 1 month free of charge. It's a riskless opportunity for you to become a Goonie today!
You can start trading with me today! (Click Here!)
Piper's Picks
No Signal Produced
Thicc Matt's Personal Trades
No Trades Taken
You can trade with me by joining the Goonie Discord today! (Click Here!)
Notes
RISK WARNING: Trading involves HIGH RISK and YOU CAN LOSE a lot of money. Do not risk any money you cannot afford to lose. Trading is not suitable for all investors. We are not registered investment advisors. We do not provide trading or investment advice. We provide research and education through the issuance of statistical information containing no expression of opinion as to the investment merits of a particular security. Information contained herein should not be considered a solicitation to buy or sell any security or engage in a particular investment strategy. Past performance is not necessarily indicative of future results. Links above include affiliate commission or referrals. I'm part of an affiliate network and I receive compensation from partnering websites.

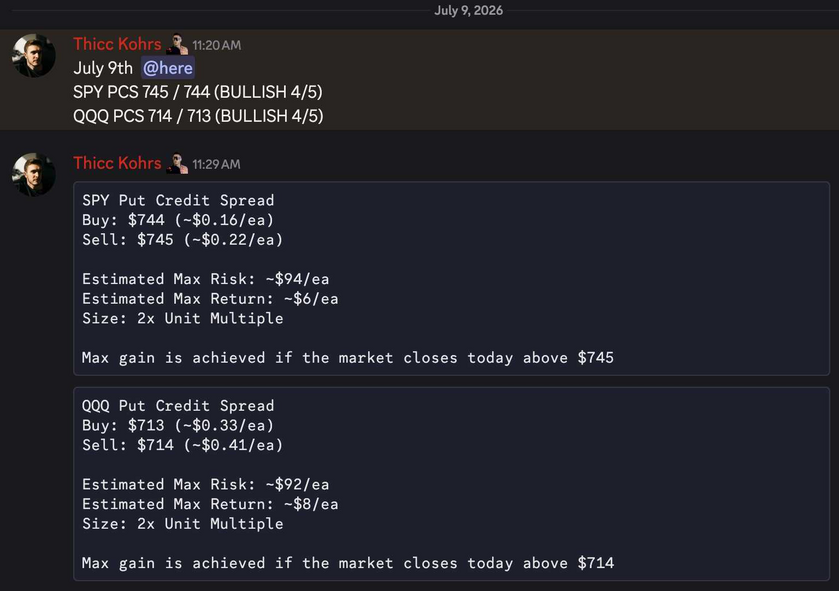 Both of these trades missed.Both of these trades hit if held until close -- 4 total units!

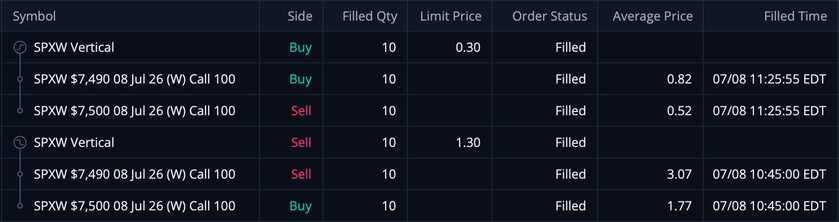 These CCS's were sold at $1.30/ea and were bought back at $0.30/ea -- THIS MEANS MY REALIZED GAIN WAS $1,000!!!