
Springing Higher?!
Key Weekly Performance Stats:
- S&P 500: +3.36%
- Nasdaq 100: +3.95%
- Russel 2000: +3.16%
- Bitcoin: +0.91%
Last week, stocks finally got a bounce, but it still felt fragile. The S&P 500 snapped its losing streak and climbed just over 3%, with the Nasdaq leading higher, as buyers stepped in after weeks of pressure. That said, the tone was still very headline-driven. Markets were glued to developments around Trump and Iran, with rising tensions pushing oil higher and keeping inflation concerns front and center. The NYSE was closed Friday for Good Friday, so traders didn’t get a full reaction in equities to the morning’s data.
The economic data painted a mixed picture. Consumer confidence ticked up a bit, but underlying responses still showed concern around inflation and the job market. JOLTS came in soft, with job openings and hiring both declining, pointing to some cooling in labor demand. ISM manufacturing stayed in expansion, but price pressures remained elevated. The trade deficit widened more than expected. Then Friday’s jobs report showed solid payroll growth, a slight dip in unemployment, and wage growth that stayed relatively contained. On the geopolitical side, tensions escalated late in the week, with Trump signaling a more aggressive stance toward Iran and reports of direct military conflict adding another layer of uncertainty.
Looking ahead to next week, the focus shifts back to inflation. Wednesday brings the Fed minutes from the March meeting along with business formation data. Thursday gives us wholesale inventories. Friday is the big one with CPI and real earnings in the morning, followed by factory orders. After the recent move in oil and everything happening geopolitically, CPI is likely to be the key driver for rate expectations and overall market direction heading into the next Fed meeting. As always, stick to your trading plan and respect your risk. Godspeed.
Thicc Kohrs
P.S. The official Goonie Discord is live! (FREE Access w/ code GOONIE: https://bit.ly/GoonieGroup)
Earnings
Market Events
Monday, Apr 6th
10:00 AM ET ISM Non-Manufacturing PMI & Prices (Mar)
Tuesday, Apr 7th
08:30 AM ET Durable Goods Orders MoM & YoY (Feb)
Wednesday, Apr 8th
10:30 AM ET Crude Oil Inventories
01:00 PM ET 10-Year Note Auction
02:00 PM ET FOMC Meeting Minutes
Thursday, Apr 9th
08:30 AM ET PCE Price Index MoM & YoY (Feb)
08:30 AM ET GDP QoQ (Q4)
08:30 AM ET Initial Jobless Claim
01:00 PM ET 30-Year Bond Auction
Friday, Apr 10th
08:30 AM ET CPI MoM & YoY (Mar)
10:00 AM ET Consumer Sentiment (Apr)
Seasonality Update
S&P 500 Seasonal Bias (Monday, Apr 6th)
- Bull Win Percentage: 50%
- Profit Factor: 0.25
- Bias: Bearish
Equity Curve -->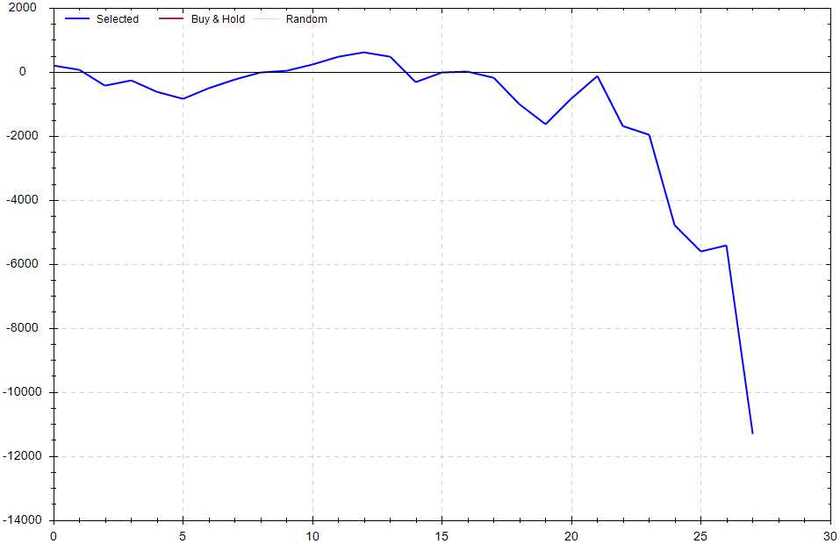
S&P 500 Seasonal Bias (Tuesday, Apr 7th)
- Bull Win Percentage: 50%
- Profit Factor: 0.53
- Bias: Leaning Bearish
Equity Curve -->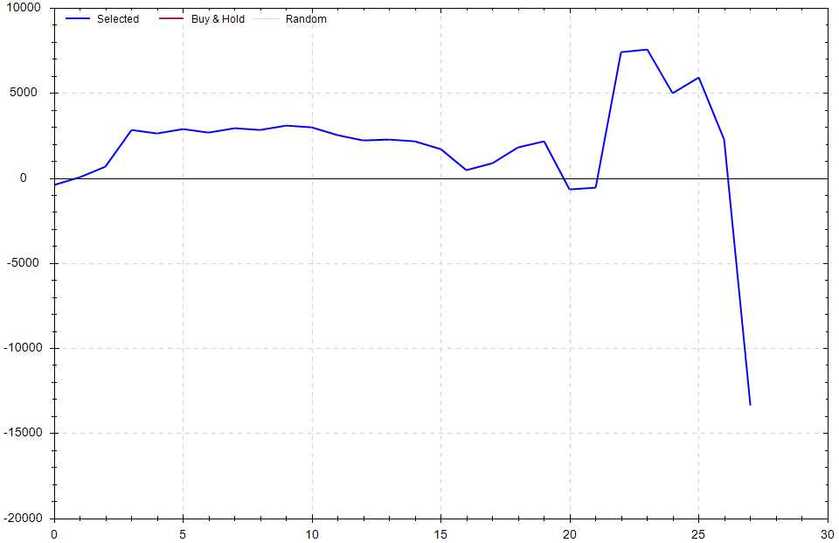
S&P 500 Seasonal Bias (Wednesday, Apr 8th)
- Bull Win Percentage: 50%
- Profit Factor: 2.04
- Bias: Leaning Bullish
Equity Curve -->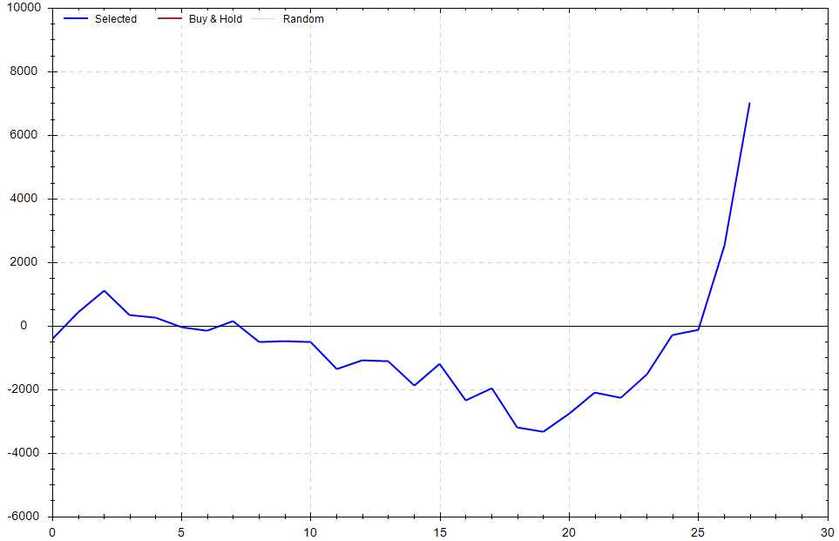
S&P 500 Seasonal Bias (Thursday, Apr 9th)
- Bull Win Percentage: 54%
- Profit Factor: 1.20
- Bias: Neutral
Equity Curve -->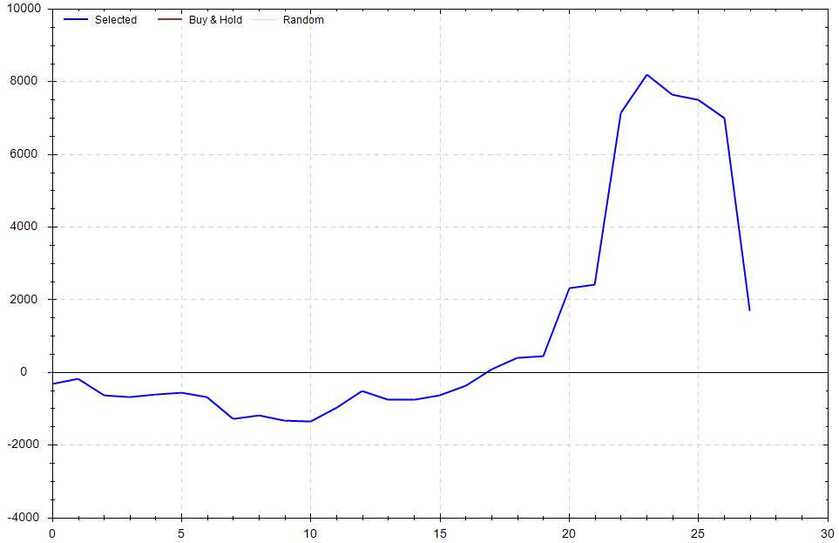
S&P 500 Seasonal Bias (Friday, Apr 10th)
- Bull Win Percentage: 46%
- Profit Factor: 3.30
- Bias: Leaning Bullish
Equity Curve -->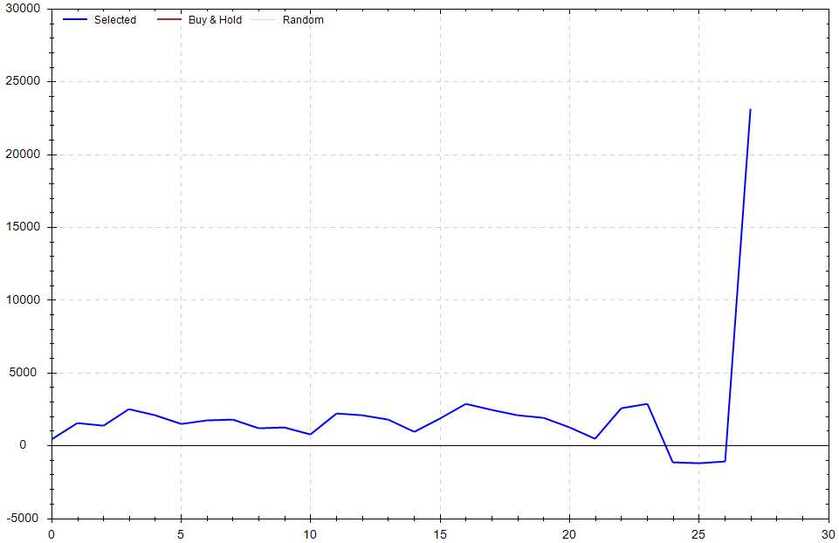
Notes: These analytics are derived from the performance of the S&P 500 futures contract over the past +25 years. Additionally, results are computed from the futures market open and close.
Options Strategy Update
The 0 DTE signal hit 4 for 4 times (8 for 8 total units) this past week.
Signal Accuracy: ~100%
Note: These signals are posted in real-time in the Goonie Trading Discord. You can join the Goonie Discord for FREE w/ code GOONIE (Click Here!)!!!
Piper's Current Signal Streak: 24 Trades
March Record: 48/52 Units
April Record: 4/4 Units
Monday, Mar 30th
SPY Call Credit Spread (2x Multiple @ $641 / $642) 🟢
QQQ Call Credit Spread (2x Multiple @ $569 / $570) 🟢
Tuesday, Mar 31st
No Signal Produced
Wednesday, Apr 1st
No Signal Produced
Thursday, Apr 2nd
SPY Put Credit Spread (2x Multiple @ $645 / $644) 🟢
QQQ Put Credit Spread (2x Multiple @ $571 / $570) 🟢
Friday, Apr 3rd
No Signal Produced
How Many Times Trump Whipsawed The Market
82 *
* This data point is from readings over the past week. The reported information should not be taken as an aggregate or cumulative value for any period beyond the most recent week (Sunday through Saturday). Appropriate alterations were made to account for both travel and time zone shifts.
Notes
RISK WARNING: Trading involves HIGH RISK and YOU CAN LOSE a lot of money. Do not risk any money you cannot afford to lose. Trading is not suitable for all investors. We are not registered investment advisors. We do not provide trading or investment advice. We provide research and education through the issuance of statistical information containing no expression of opinion as to the investment merits of a particular security. Information contained herein should not be considered a solicitation to buy or sell any security or engage in a particular investment strategy. Past performance is not necessarily indicative of future results. Links above include affiliate commission or referrals. I'm part of an affiliate network and I receive compensation from partnering websites.


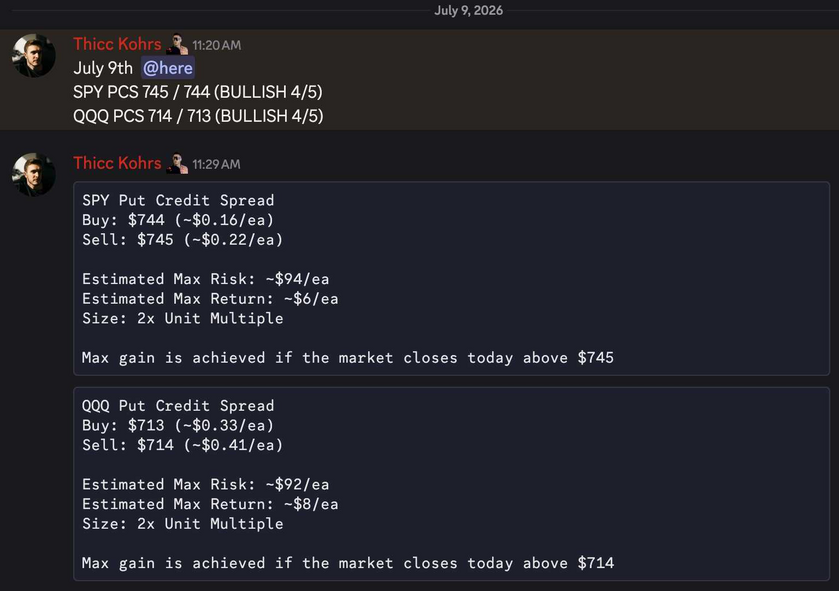 Both of these trades missed.Both of these trades hit if held until close -- 4 total units!

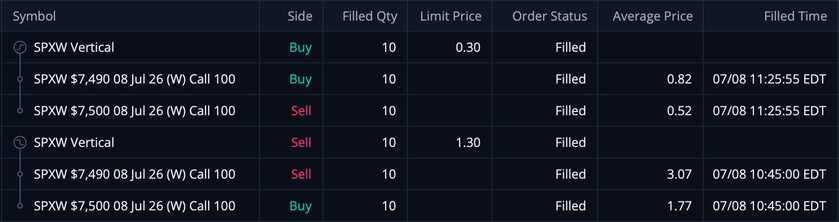 These CCS's were sold at $1.30/ea and were bought back at $0.30/ea -- THIS MEANS MY REALIZED GAIN WAS $1,000!!!