
New Year, New Trader! ...Maybe
Hey Y'all,
How'd your trading go the first week of the New Year? You stuck your plans, right? ...right?
Joking aside, I truly hope you crushed the market last week. The first two days were relatively typical trend-following days. The concluding two days were a bit more volatile. I must admit I was surprised myself and got whipped out of my position both days. I don't think things will be returning to "easy" anytime soon.
The market is no longer in an obvious bullish uptrend, and earnings season is right around the corner. With those two new developments, don't be afraid of sizing down or skipping trade all together. I know it's said by everyone, but it truly does do wonders when you're patient and wait for your perfect setup. One trade won't make you, but one trade can definitely break you.
Posted below are the key earnings announcement that I think you'll be interested in that will most certainly have an impact on the overall market. As always, I included the pivotal macroeconomic reports and seasonality as well. Enjoy!
Warm Regards,
Matt
P.S. The official Goonie Discord is live! (FREE Access w/ code 2024: https://bit.ly/GoonieGroup)
Market Events
Monday, Jan. 8th
None
Tuesday, Jan. 9th
None
Wednesday, Jan. 10th
10:30 AM ET Crude Oil Inventories
01:00 PM ET 10-Year Note Auction
Thursday, Jan. 11th
08:30 AM ET CPI (MoM) (Dec)
08:30 AM ET CPI (YoY) (Dec)
08:30 AM ET Initial Jobless Claims
Friday, Jan. 12th
08:30 AM ET PMI (MoM) (Dec)
Upcoming Earnings
Monday
None
Tuesday
AM: Tilray
Wednesday
None
Thursday
None
Friday
AM: Bank of America, Blackrock, BNY Mellon, Citi, Delta Airlines, JP Morgan, UnitedHealth Group & Wells Fargo
Seasonality Update
S&P 500 Seasonal Bias (Monday, Jan. 8th)
- Bull Win Percentage: 60%
- Profit Factor: 1.62
- Bias: Bullish
Equity Curve -->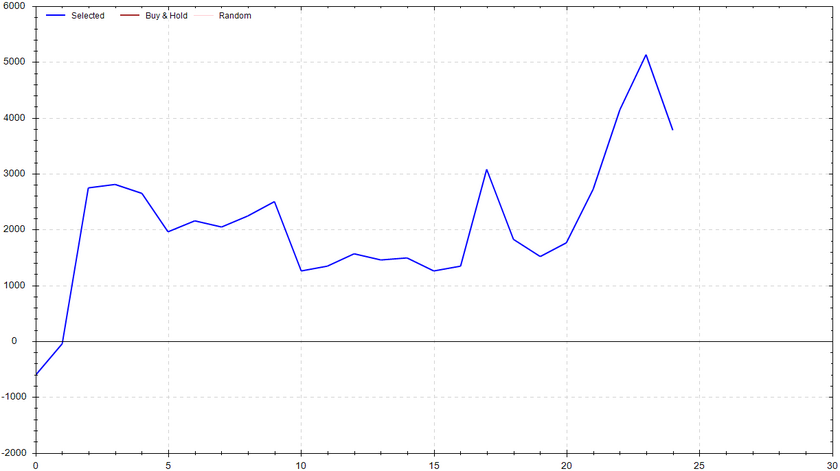
S&P 500 Seasonal Bias (Tuesday, Jan. 9th)
- Bull Win Percentage: 52%
- Profit Factor: 0.75
- Bias: Neutral
Equity Curve -->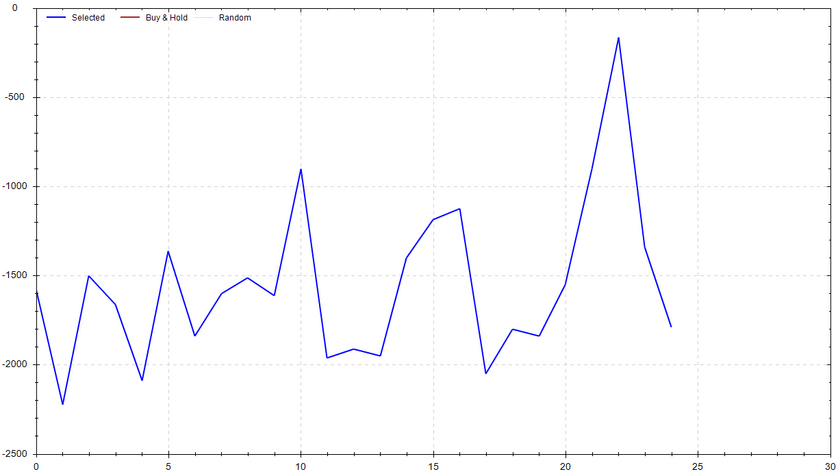
S&P 500 Seasonal Bias (Wednesday, Jan. 10th)
- Bull Win Percentage: 72%
- Profit Factor: 1.62
- Bias: Bullish
Equity Curve -->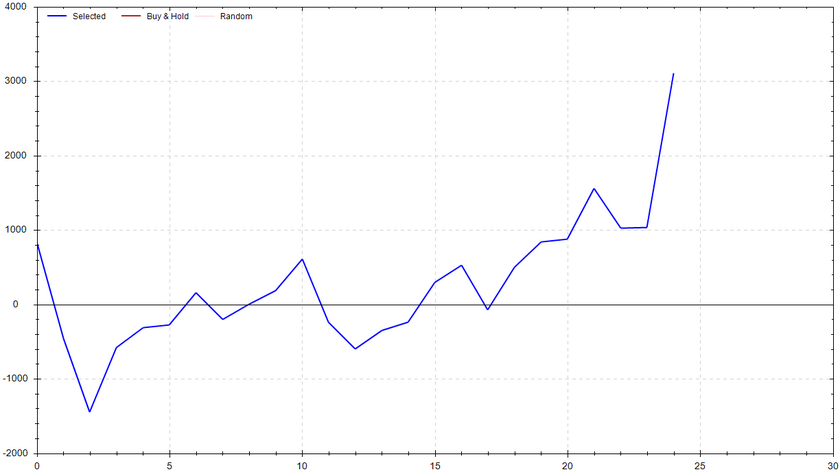
S&P 500 Seasonal Bias (Thursday, Jan. 11th)
- Bull Win Percentage: 48%
- Profit Factor: 0.90
- Bias: Leaning Bearish
Equity Curve -->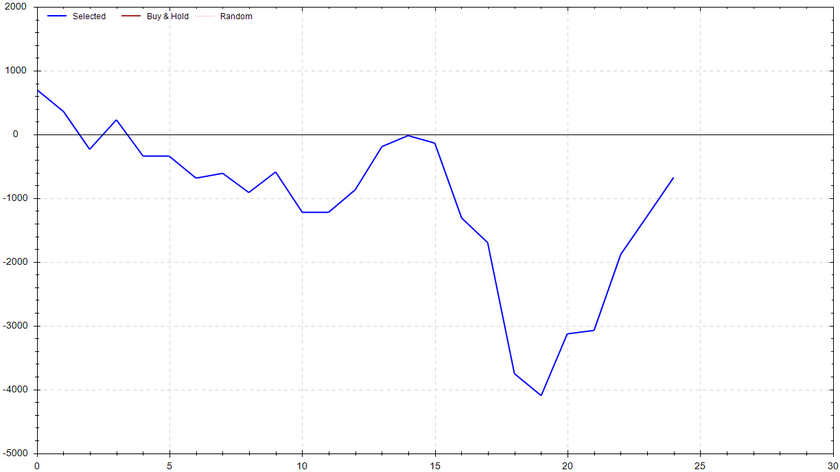
S&P 500 Seasonal Bias (Friday, Jan. 12th)
- Bull Win Percentage: 44%
- Profit Factor: 0.75
- Bias: Leaning Bearish
Equity Curve -->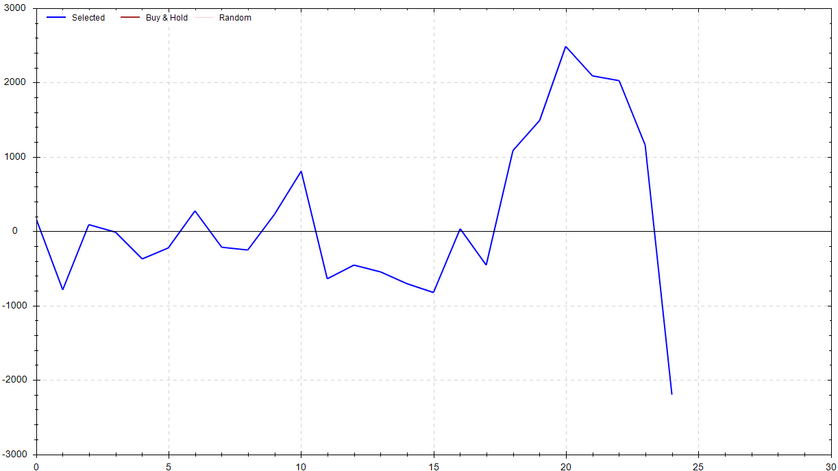
Options Strategy Update
The 0 DTE signal hit 3 for 4 times (14 for 16 total units) this past week (Signal Accuracy: ~75%).
The signal wasn't perfect this past week, but it was darn close. I'm really excited about how the incorporation of the unit multiplier is playing out. Similar to Blackjack, the system bets more when it is more confident. This was showcased last week when the only losing day was a 1x unit multiplier -- The system was the least confident it could be to still execute a trade. I hope it assisted you in making more quality trades. Cheers!
Current Streak: 2
January Record: 14/16
Monday Jan. 1st
None
Tuesday Jan. 2nd
SPY CALL Credit Spread (3x Multiple @ $473 / $474) 🟢
QQQ CALL Credit Spread (3x Multiple @ $407 / $408) 🟢
Wednesday Jan. 3rd
SPY CALL Credit Spread (2x Multiple @ $471 / $472) 🟢
QQQ CALL Credit Spread (2x Multiple @ $402 / $403) 🟢
Thursday Jan. 4th
SPY PUT Credit Spread (1x Multiple @ $468 / $467) 🔴
QQQ PUT Credit Spread (1x Multiple @ $396 / $395) 🔴
Friday Jan. 5th
SPY PUT Credit Spread (2x Multiple @ $467 / $466) 🟢
QQQ PUT Credit Spread (2x Multiple @ $396 / $395) 🟢
Charts of Interest
SPY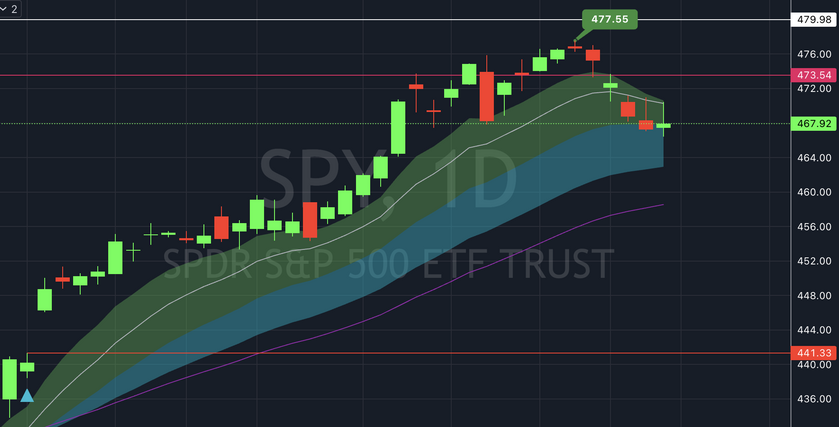
The S&P 500 is now sitting at the 20 EMA after it was rejected from notching a new all-time high. If this level can hold, I'll be looking for a push and close above $472. From there, I would be watching for a test of $476. However if this level can't hold, I'd be prepping for the low $460s.
QQQ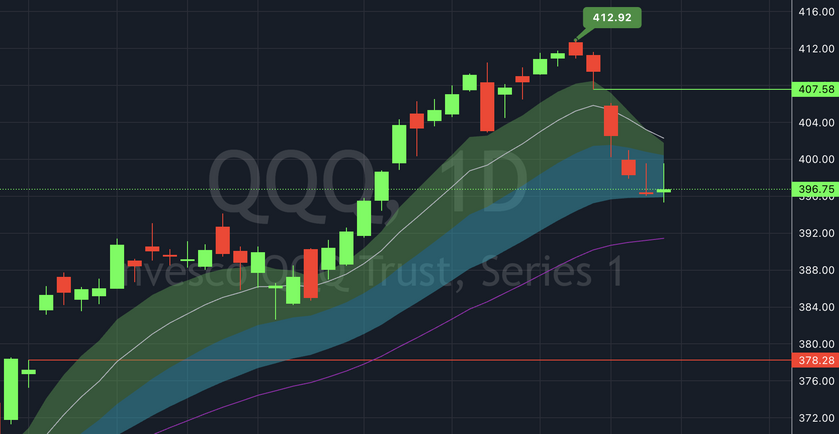
The Nasdaq sold off all the way down to its 34 EMA after hitting a new all-time high to conclude the year. If this level doesn't hold, $392 appears to be in the cards. If the bulls push the price above the key level of $400, I would personally be looking for a reversion to $404. Don't forget there is now a new upside gap fill to $407ish.
BTC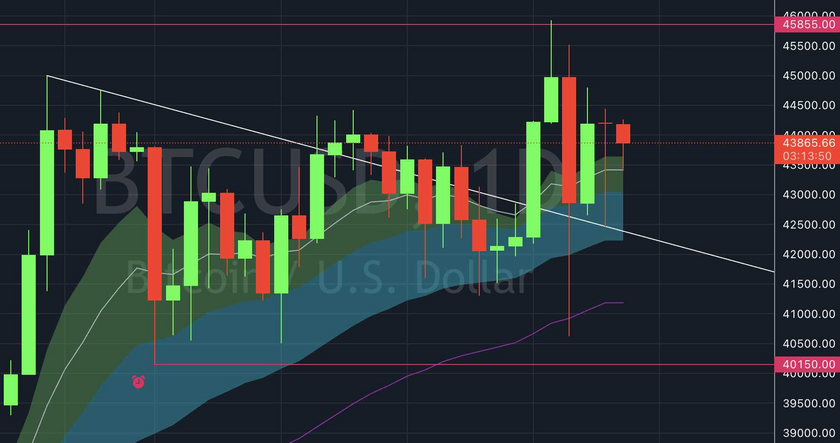
Bitcoin is continuing to hold its breakout after some serious short-term volatility. The upcoming moves will most likely be driven by any news related to the Spot ETF. I would love a break and hold of $48k-$50k, but it will most likely be a crazy ride. Buckle up for sure!
TSLA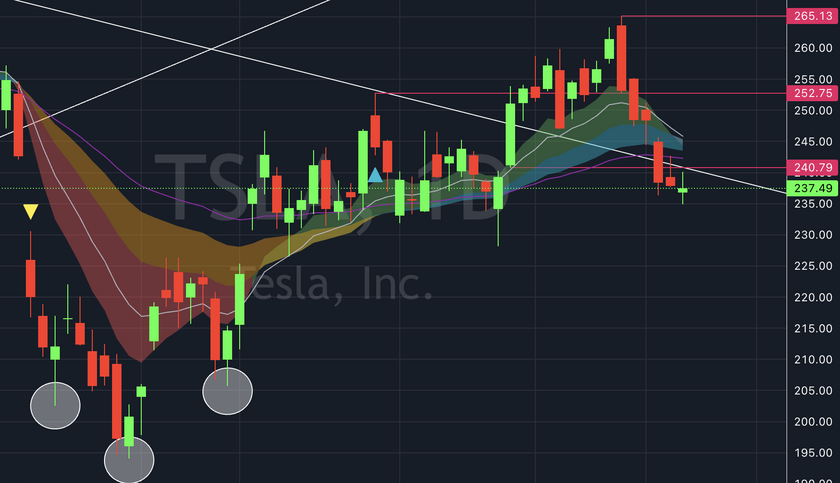
Teslerrr appears to be breaking down. If $245 is quickly recaptured, I'd be looking for an additional capitulation down to $225-$230.
NVDA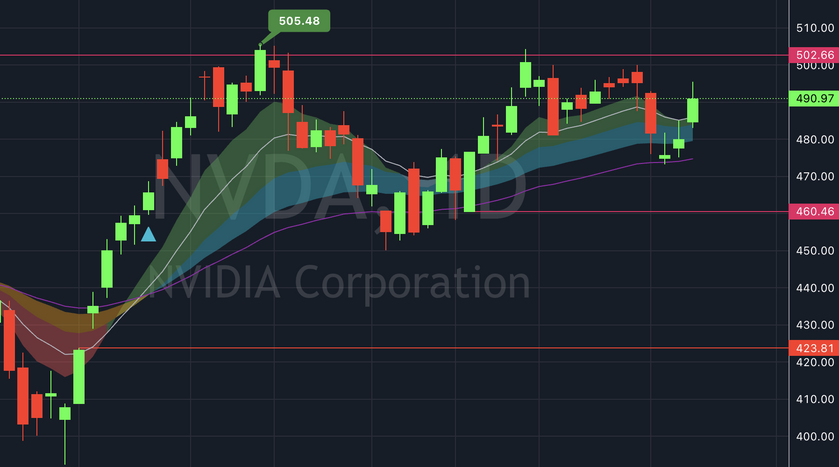
Stop me if you've heard this before, but Nvidia is showing strength. NVDA perfectly bounced off the 48 EMA and now seems eager to retest $500. Get the popcorn ready!
META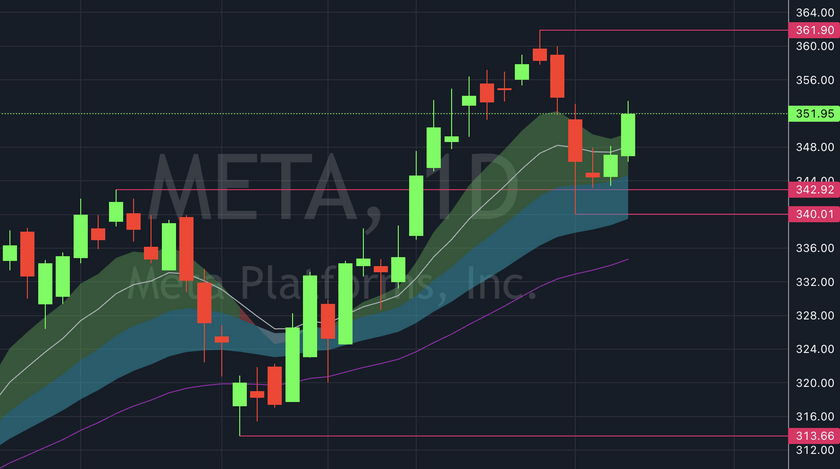
I love this pattern! META ripped, consolidated, and is now gearing up for an additional push. If you like this sort of play, $340ish would be your risk, and $362 would be your targeted breakout.
MSFT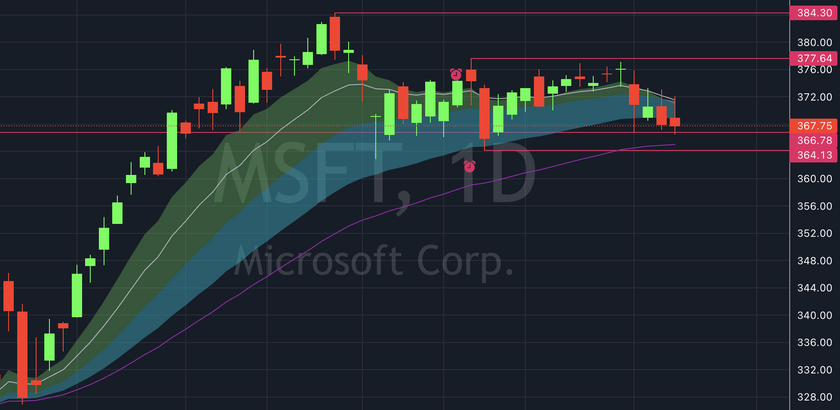
Microsoft is continuing to consolidate. When this range finally breaks, I believe we will be in store for a considerable move. For the sake of transparency, I want you to know I'm still holding my MSFT stock position.
NFLX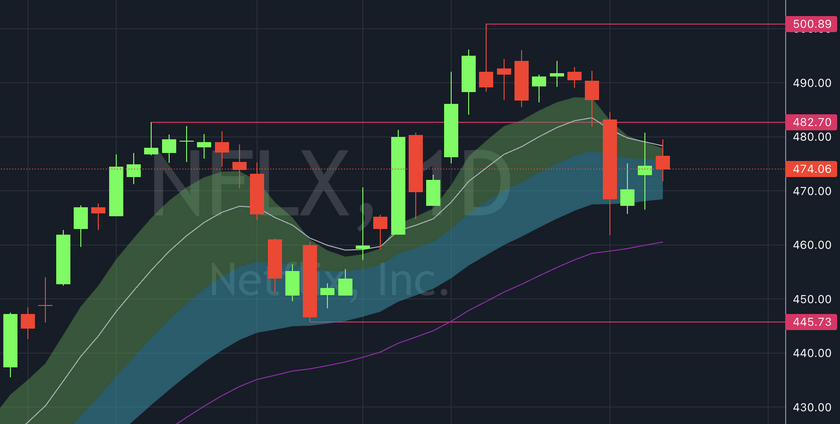
Similar to META, Netflix looks solid. A break and hold of $480 could easily lead to +$500. If I were to play this, my risk would be set just above the low $460s.
AAPL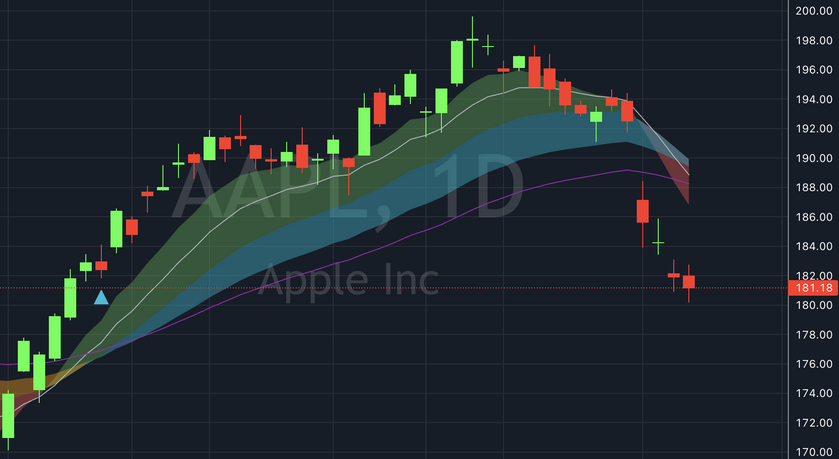
BREAKDOWN ALERT! Apple looks like it is in some considerable trouble. Be careful of attempting to catch a falling knife.
AMZN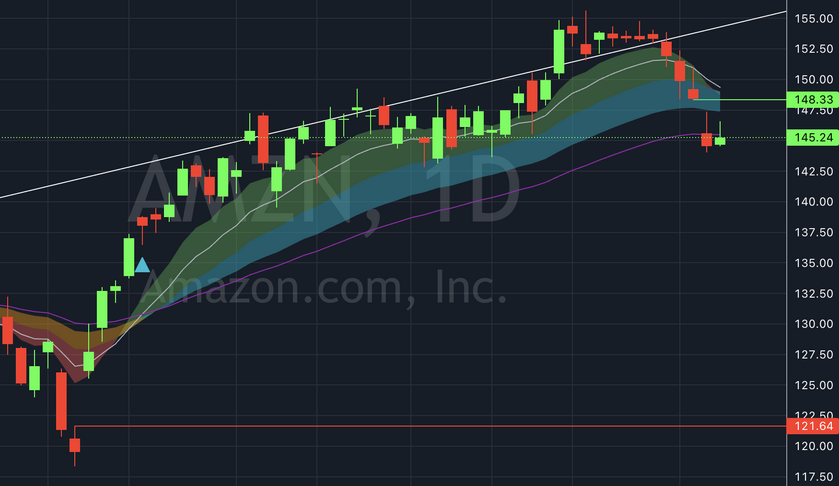
Amazon is tittering. The stock is currently sitting at the pivotal 48 EMA level. I'll be watching closely for a bounce upside gap fill or an official breakdown -- stay tuned.
Times My Totally Real Fiancée Told Me To Shave My Beard
88 *
* This data point is from readings over the past week. The reported information should not be taken as an aggregate or cumulative value for any period beyond the most recent week (Sunday through Saturday). Appropriate alterations were made to account for both travel and time zone shifts.
Notes
RISK WARNING: Trading involves HIGH RISK and YOU CAN LOSE a lot of money. Do not risk any money you cannot afford to lose. Trading is not suitable for all investors. We are not registered investment advisors. We do not provide trading or investment advice. We provide research and education through the issuance of statistical information containing no expression of opinion as to the investment merits of a particular security. Information contained herein should not be considered a solicitation to buy or sell any security or engage in a particular investment strategy. Past performance is not necessarily indicative of future results. Links above include affiliate commission or referrals. I'm part of an affiliate network and I receive compensation from partnering websites.


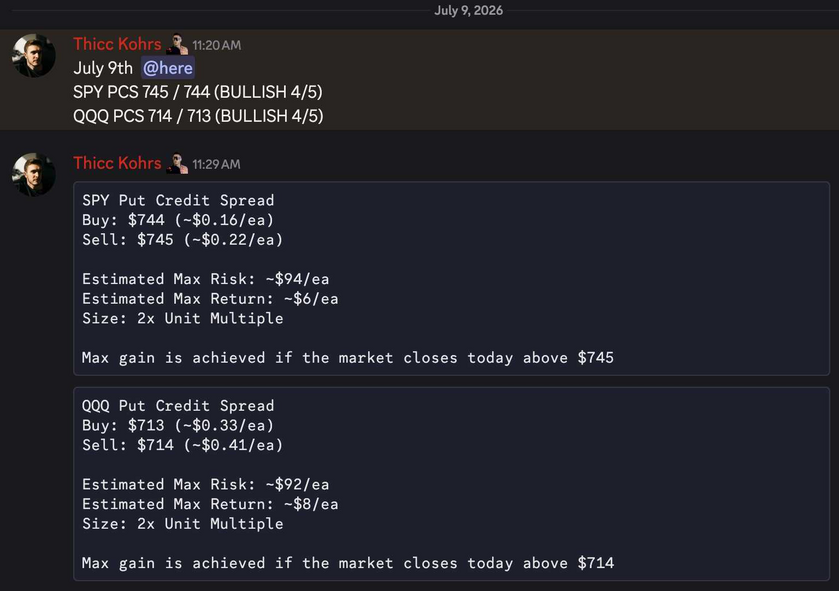 Both of these trades missed.Both of these trades hit if held until close -- 4 total units!

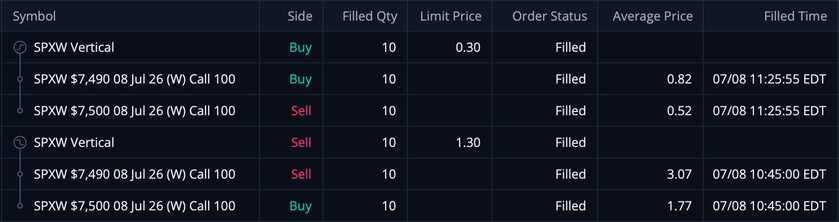 These CCS's were sold at $1.30/ea and were bought back at $0.30/ea -- THIS MEANS MY REALIZED GAIN WAS $1,000!!!