
Chop City
My apologies. I'm sorry for missing Thursday's newsletter.
I was preoccupied with a fever, body shakes and vomiting. You'll be happy to know I had the Type A Flu, and I recorded the highest fever of the day at the urgent care. If you ask me, that's pure grindset. Whatever you're going to do, be the best at it. Set the records. Take no prisoners -- Even if the would-be prisoners are the fluids your body desperately needs.
It all honesty, I don't remember too much about what happened on Thursday or Friday. I reviewed all the charts and breaking news from the past two to get back up to speed. To me, it seems like the typical volatile nothingness. The market has been in chop city mode since March 16th's sizable gain. From then until now, it's violently going nowhere and doing nothing but whipping people out of their positions.
This is an extremely frustrating environment to trade in. It's not just that you’re breaking your rules and being undisciplined. I mean... sure. That doesn't help at all, and you should totally work on that the way you said you would for the past few months, but whatever. Even if you turned into the Buddha of trading overnight, it's tough to handle multiple large whipsaw days consecutively.
You can't cry over spilled milk. Take the craziness for whatever lesson you can (most likely sizing down and more patience), then move on to the next trade.
I do want to quickly note that there is one class of trader who is clearly winning -- premium sellers. Since volatility is higher, option's premium is higher, which means the credit received when selling to open is higher. Then, when you realize we are violently going nowhere, you realize most of that premium sold is expiring worthless. What an ideal time to be the house!
Market Events: Monday, March 27th
05:00 PM Fed Gov. Jefferson Speaks
Seasonality Update
S&P 500 Seasonal Bias (March 27th)
- Bull Win Percentage: 44%
- Profit Factor: 2.27
- Bias: Leaning Bullish
Equity Curve -->

Current Account Value (March 25th)
$9,344
Daily Realized P&L: +$0
YTD Realized P&L: +$436
Closed Position(s)
None
New Position(s)
None
Current Position(s)
NVDA Call Credit Spread (2) March 31st
- Sold: $270 & Bought: $275 --> Credit: $71
- Max Return: $71 & Max Risk: $429
- Current Value: $203
- Profit Target: $25
- Profit Odds: 56%
OXY Put Credit Spread (10) March 31st
- Sold: $58 & Bought: $57 --> Credit: $20
- Max Return: $20 & Max Risk: $80
- Current Value: $39
- Profit Target: $8
- Profit Odds: 52%
QQQ Call Credit Spread (10) March 31st
- Sold: $312 & Bought: $313 --> Credit: $0.20
- Max Return: $20 & Max Risk: $80
- Current Value: $53
- Profit Target: $8
- Profit Odds: 52%
TSLA Call Credit Spread (4) March 31st
- Sold: $200 & Bought: $202.50 --> Credit: $37
- Max Return: $37 & Max Risk: $213
- Current Value: $55
- Profit Target: $15
- Profit Odds: 67%
JPM Put Credit Spread (5) April 6th
- Sold: $125 & Bought: $120 --> Credit: $100
- Max Return: $100 & Max Risk: $400
- Current Value: $181
- Profit Target: $40
- Profit Odds: 49%
SPY Call Credit Spread (5) April 6th
- Sold: $406 & Bought: $407 --> Credit: $12
- Max Return: $23 & Max Risk: $77
- Current Value: $27
- Profit Target: $10
- Profit Odds: 78%
SPY Iron Condor (3) April 6th
- $411/$412 Call Spread --> Credit: $18
- $386/$385 Put Spread --> Credit: $19
- Max Return: $37 & Max Risk: $63
- Current Value: $31
- Profit Target: $15
- Profit Odds: 74%
TSLA Call Credit Spread (5) April 6th
- Sold: $207.50 & Bought: $210 --> Credit: $40
- Max Return: $40 & Max Risk: $210
- Current Value: $53
- Profit Target: $15
- Profit Odds: 78%
SPY Iron Condor (5) April 14th
- $411/$412 Call Spread --> Credit: $20
- $375/$374 Put Spread --> Credit: $17
- Max Return: $37 & Max Risk: $63
- Current Value: $36
- Profit Target: $15
- Profit Odds: 81%
TLT Put Credit Spread (10) April 21st
- Sold: $101 & Bought: $100 --> Credit: $27
- Max Return: $27 & Max Risk: $73
- Current Value: $15
- Profit Target: $10
- Profit Odds: 82%
My Thoughts
I did not create or close any positions over the past two days. If my brain was functions properly, I would have created an Iron Condor on each day. There is going to be a roughly 15 to 25 day lag before the Condors start printing on the regular basis. Patience will pay, but I'm definitely excited.
As discussed in the past few newsletters, I'm closely watching how the SPY is doing relative to the 200-day simple moving average. Even though we've been ping-ponging the line, I think something on the larger timeframe is starting to form.

Note #1: Over the past 3 trading days, the bulls have successfully protected the 200-day SMA.
Note #2: The breakdown of the (white) 2022 trendline was a fake out breakdown.
Note 3#: We are starting to see the formation of an inverse head and shoulder pattern.
Obviously, there is no way you could guarantee where the market will go next (especially in a news-driven environment). I'd probably have a better shot of knowing where my completely real girlfriend wants to go to dinner, and that legitimately impossible. But, to dumb brain, the technicals are seemingly starting to favor the bulls. I'll be keeping this all in my mind along with the fact that one lackluster report or rouge comment from Powell/Yellen/Biden could ruin the party.
If the SPY were to fall below $390, I'd become pretty bearish. If the SPY were to break above and hold the $400-$402 region, I'd size up my bullish bets.
Would love to know your thoughts. Please feel free to share!
Thanks for reading -- Much love!
Notes
Max Return (Credit Spreads): The credit received when creating the position. This is achieved when you get to the expiration date and the price is below the sold contract for a Call Credit Spread and above the sold contract for a Put Credit Spread.
Max Risk (Credit Spreads): The difference between the spread's two strikes minus the credit received when the position was created.
Breakeven (Credit Spreads): The sold strike plus the credit for CCS and the strike minus the credit for PCS.
RISK WARNING: Trading involves HIGH RISK and YOU CAN LOSE a lot of money. Do not risk any money you cannot afford to lose. Trading is not suitable for all investors. We are not registered investment advisors. We do not provide trading or investment advice. We provide research and education through the issuance of statistical information containing no expression of opinion as to the investment merits of a particular security. Information contained herein should not be considered a solicitation to buy or sell any security or engage in a particular investment strategy. Past performance is not necessarily indicative of future results. Links above include affiliate commission or referrals. I'm part of an affiliate network and I receive compensation from partnering websites.


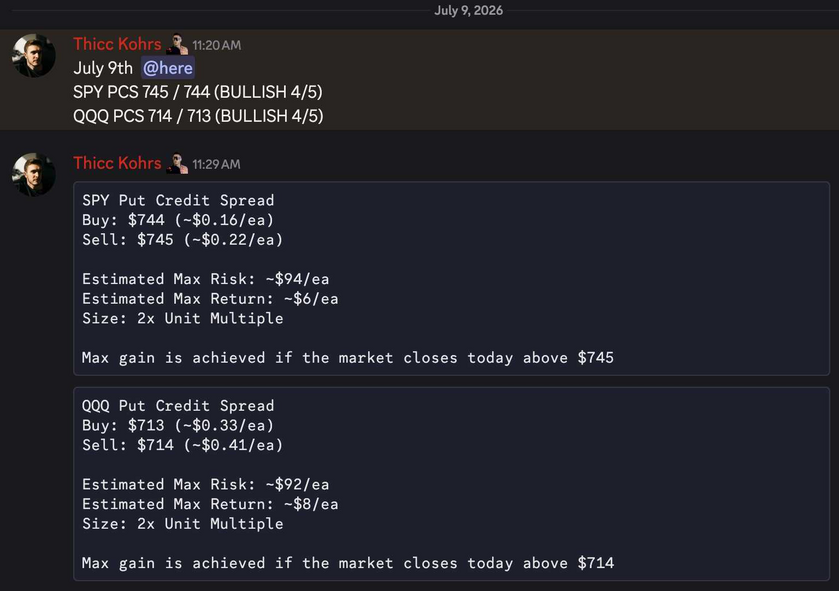 Both of these trades missed.Both of these trades hit if held until close -- 4 total units!

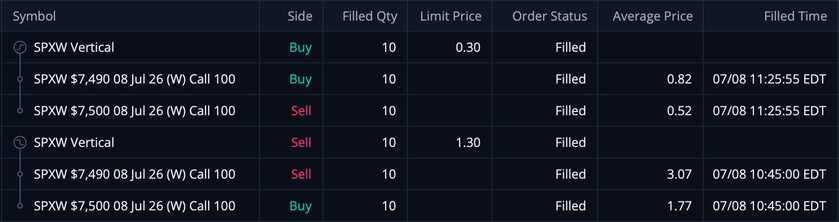 These CCS's were sold at $1.30/ea and were bought back at $0.30/ea -- THIS MEANS MY REALIZED GAIN WAS $1,000!!!