Storming The Gates
To Whom It May Concern,
The bar-bear-ians are the gates. The bulls were clearly in control from Oct. 6th (Friday) to Oct. 11th (Wednesday). This might seem odd due to the outbreak of war in Israel, but history tells us stocks tend to rally on the announce of global conflict. This bullish momentum didn't last all week. Within the US, political turmoil continues to increase as a new Speaker of The House still needs to be elected. I wish that were the only "negative" piece of news, but don't forget, we are in spooky season.
Two inflation reports were dropped last week: PPI & CPI. Both came in higher (hotter) than expected. This is bearish for equities because it shows that inflation is persisting as a pain in the ass of monetary policy. Notably, the treasury auction on Thursday was a glorified shitshow -- 18% of the inventory was unsold. When you consider all these developments, it's no surprise that volatility, yields and the dollar are all ripping higher. If this trend were to continue, I would fully expect the market to keep falling.
Looking forward, we have lots to pay attention to. Not only do we have a normal slate of macroeconomic announcements, but earnings season is officially underway. Various financial institutions have already reported bullish results. I'll be paying attention to see if that trend continues, but I'm really interested in the major tech names: Netflix & Tesla. Obviously, it will also be incredibly important to pay attention to any developments in Israel. I hope I'm wrong, but I fear that the ending of the Israel - Saudi normalization talks will have far reaching implications.
Warm Regards,
Matthew Maximus Kohrs
Market Events
Monday, Oct. 16th
None
Tuesday, Oct. 17th
08:30 AM ET Retail Sales (MoM) (Sep)
08:30 AM ET Core Retail Sales (MoM) (Sep)
Wednesday, Oct. 18th
05:00 AM ET EURO CPI (YoY) (Sep)
08:30 AM ET Building Permits (Sep)
Thursday, Oct. 19th
08:30 AM ET Initial Jobless Claims
08:30 AM ET Philadelphia Fed Manufacturing Index (Oct)
10:00 AM ET Existing Home Sales (Sep)
Friday, Oct. 20th
None
Upcoming Earnings
Monday
AM: Charles Schwab
PM: First Bank
Tuesday
AM: Bank of America, BNY Mellon, Goldman Sachs, Johnson & Johnson, Lockheed Martin
PM: Interactive Brokers & United
Wednesday
AM: Morgan Stanley, P&G
PM: Discover, Netflix, Sands & Tesla
Thursday
AM: American Airlines, AT&T & TSMC
Friday
AM: American Express & SLB
Note: This is NOT the full list -- I included the names of companies that are popular within the Goonie Community.
Seasonality Update
S&P 500 Seasonal Bias (Monday, Oct. 16th)
- Bull Win Percentage: 53.8%
- Profit Factor: 1.30
- Bias: Neutral
Equity Curve -->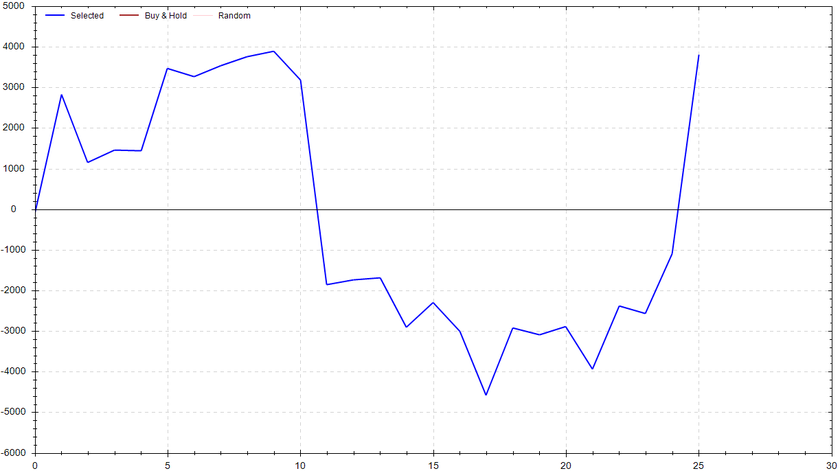
S&P 500 Seasonal Bias (Tuesday, Oct. 17th)
- Bull Win Percentage: 61.5%
- Profit Factor: 2.22
- Bias: Bullish
Equity Curve -->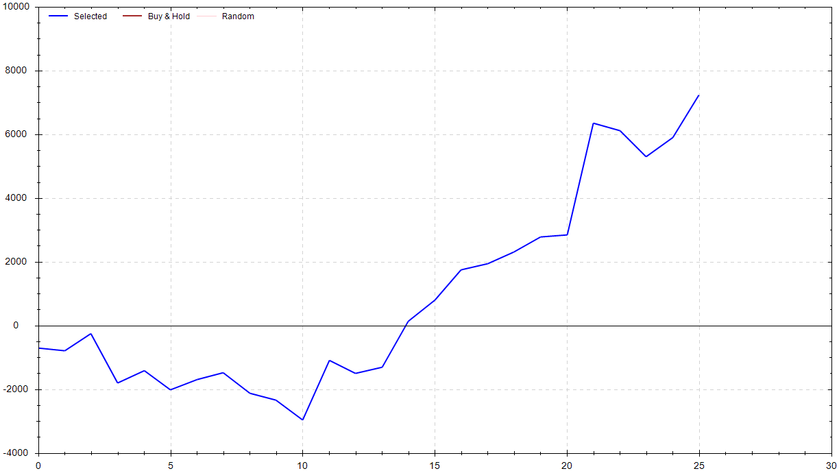
S&P 500 Seasonal Bias (Wednesday, Oct. 18th)
- Bull Win Percentage: 57.7%
- Profit Factor: 0.82
- Bias: Neutral
Equity Curve -->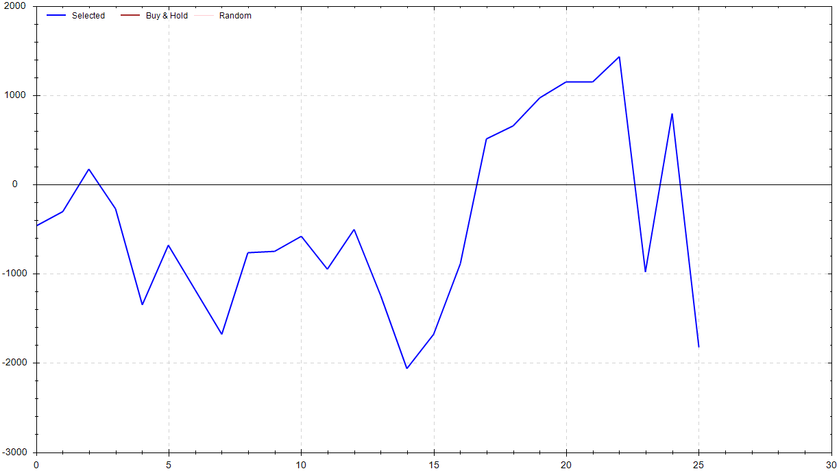
S&P 500 Seasonal Bias (Thursday, Oct. 19th)
- Bull Win Percentage: 50%
- Profit Factor: 1.48
- Bias: Leaning Bullish
Equity Curve -->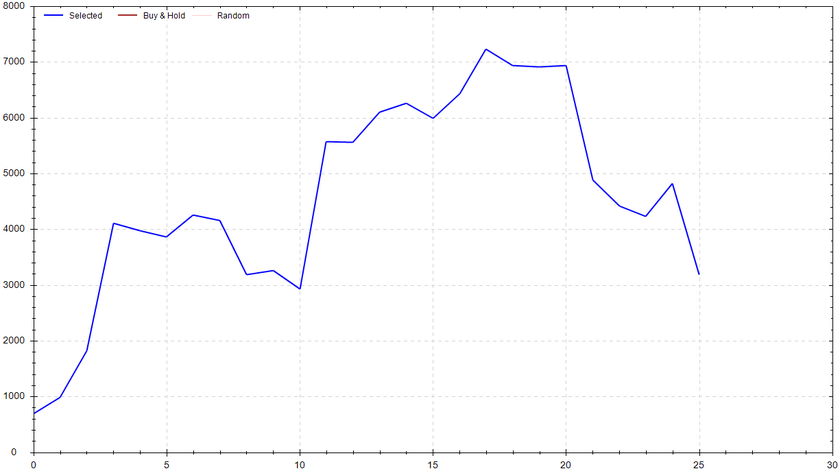
S&P 500 Seasonal Bias (Friday, Oct. 20th)
- Bull Win Percentage: 61.5%
- Profit Factor: 1.83
- Bias: Bullish
Equity Curve -->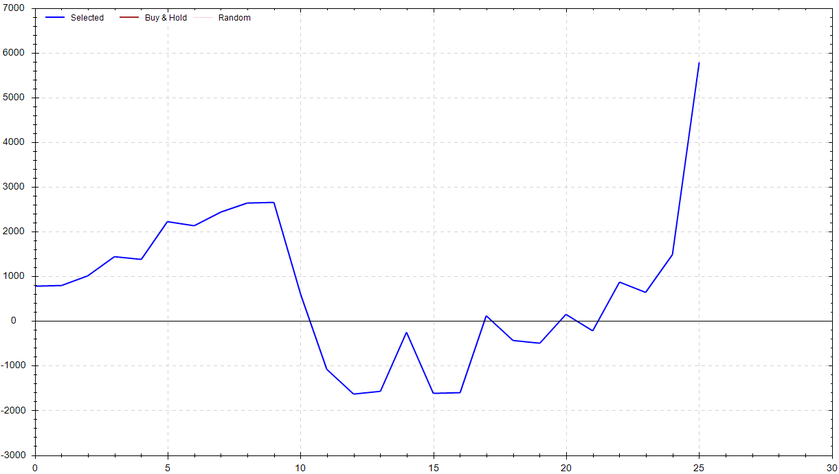
Options Strategy Update
The 0 DTE signal went 6 out of 10 (~60% accuracy)*.
This is the first reported week that the accuracy was clearly under expectations. This can happen by chance, but it can also obviously happen if the signal needs to be improved. I've been testing the concept of not allowing any signals to fire until 10:30am ET -- it's currently set to 10:00am ET. Moving forward, I'll be watching both to find if one is clearly superior.
Monday Oct. 9th
SPY CALL Credit Spread ($430 / $431) 🔴
QQQ CALL Credit Spread ($364 / $365) 🔴
Tuesday Oct. 10th
SPY PUT Credit Spread ($433 / $432) 🟢
QQQ PUT Credit Spread ($366 / $365) 🟢
Wednesday Oct. 11th
SPY CALL Credit Spread ($437 / $438) 🟢
QQQ CALL Credit Spread ($372 / $373) 🟢
Thursday Oct 12th
SPY PUT Credit Spread ($435 / $434) 🔴
QQQ PUT Credit Spread ($371 / $370) 🔴
Friday Oct 13th
SPY CALL Credit Spread ($437 / $438) 🟢
QQQ CALL Credit Spread ($373 / $374) 🟢
Charts of Interest
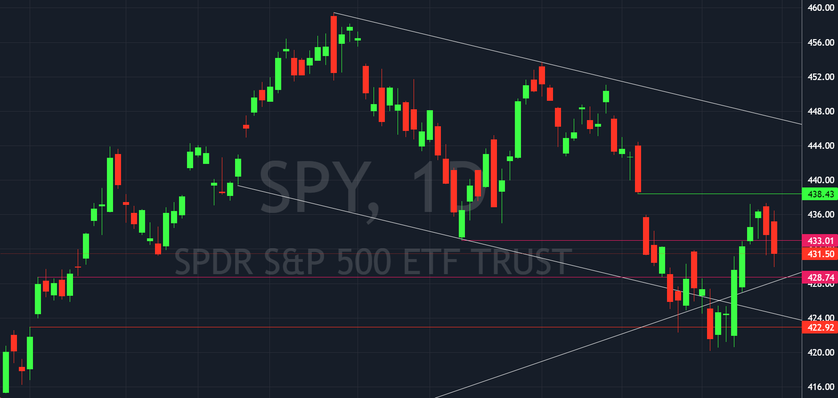 The SPY did not have enough gas in the tank to hit the $438.43 upside gap fill. If the price action immediately reverts, I'll still be looking for that target. As of now, the bears appear to be in control. My personal area of interest (potential bounce) would be $429. If the support does not hold, I'd be watching $425 followed by $421.
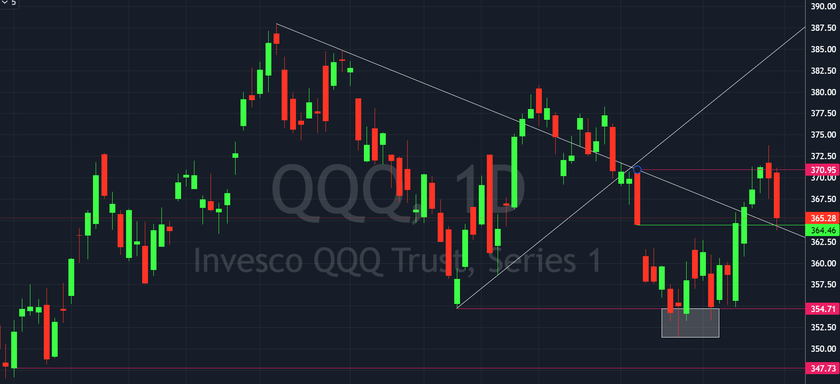 On a relative basis, the QQQ's are outperforming the overall market. The tech-dominant fund successfully hit the upside gap fill and then some. However, as with the SPY, the conclusion of the week clearly favored the bears. Support was eventually found at the down-slopping trendline. If this trend continues, I'd be looking for $362.50 followed by $360. If this support holds, the next stop for the bulls would be $370 imo.
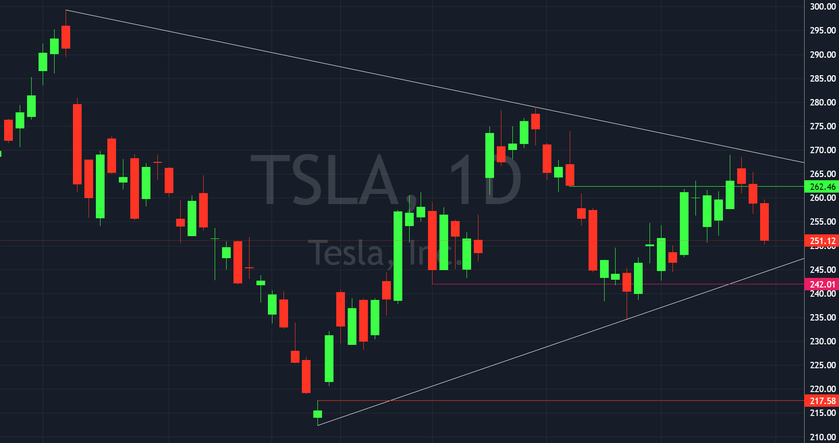 TSLA is still filling out it's bullish pennant pattern. The next reaction level is $245ish.
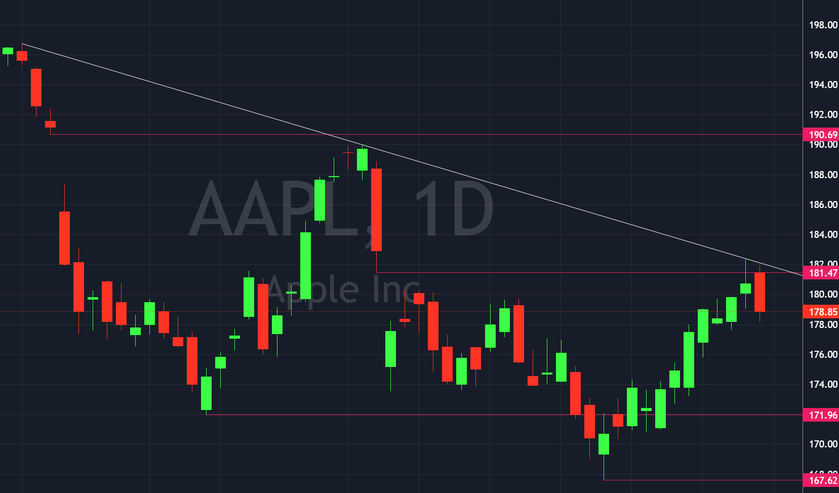 APPL was perfectly rejected at its trendline. Watch for the continuation to the downside.
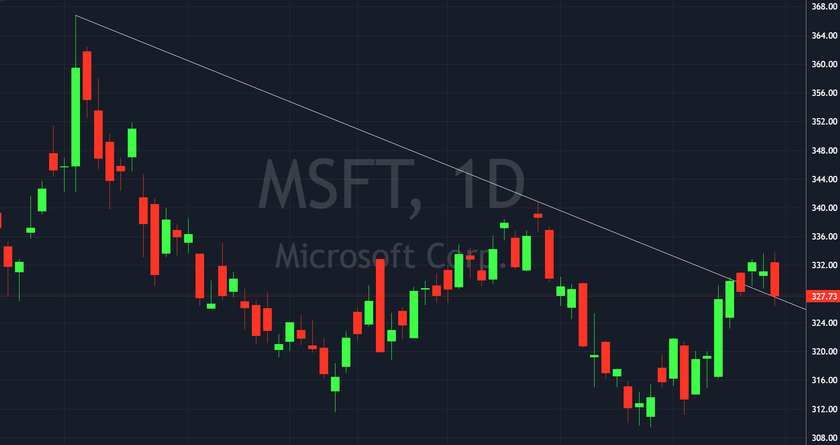 Moment of truth -- Watching to see if the MSFT breakout is real or not.
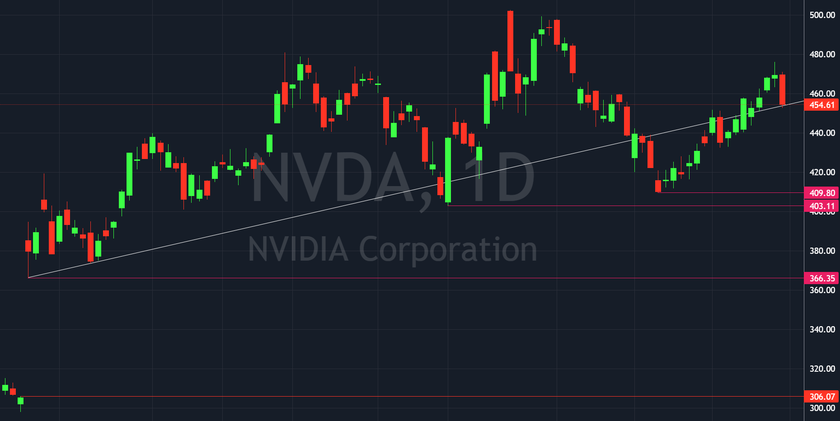 Similar situation for NVDA. Time to see if the breakout is real or not.
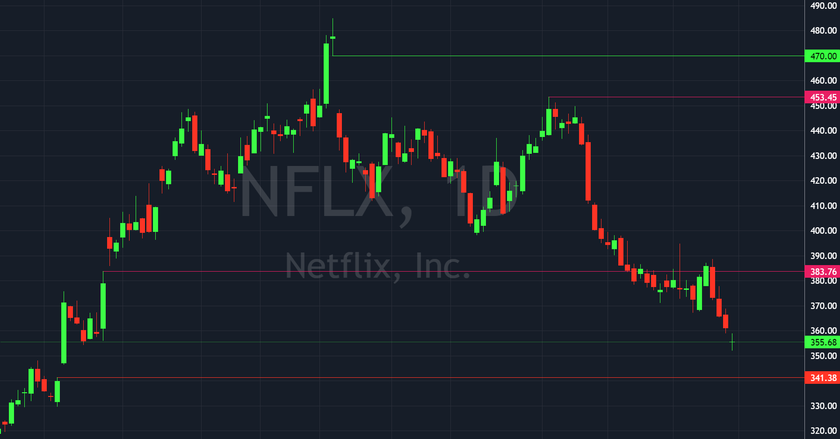 NFLX is continuing to capitulate. As stated previously, I'm still looking for the gap fill at $341.38.
Times I Reminded The Community I'm The Best Trader on This Side of The Mississippi
1.5 *
* This data point is from readings over the past week. The reported information should not be taken as an aggregate or cumulative value for any period beyond the most recent week (Sunday through Saturday). Appropriate alterations were made to account for both travel and time zone shifts.
Notes
RISK WARNING: Trading involves HIGH RISK and YOU CAN LOSE a lot of money. Do not risk any money you cannot afford to lose. Trading is not suitable for all investors. We are not registered investment advisors. We do not provide trading or investment advice. We provide research and education through the issuance of statistical information containing no expression of opinion as to the investment merits of a particular security. Information contained herein should not be considered a solicitation to buy or sell any security or engage in a particular investment strategy. Past performance is not necessarily indicative of future results. Links above include affiliate commission or referrals. I'm part of an affiliate network and I receive compensation from partnering websites.


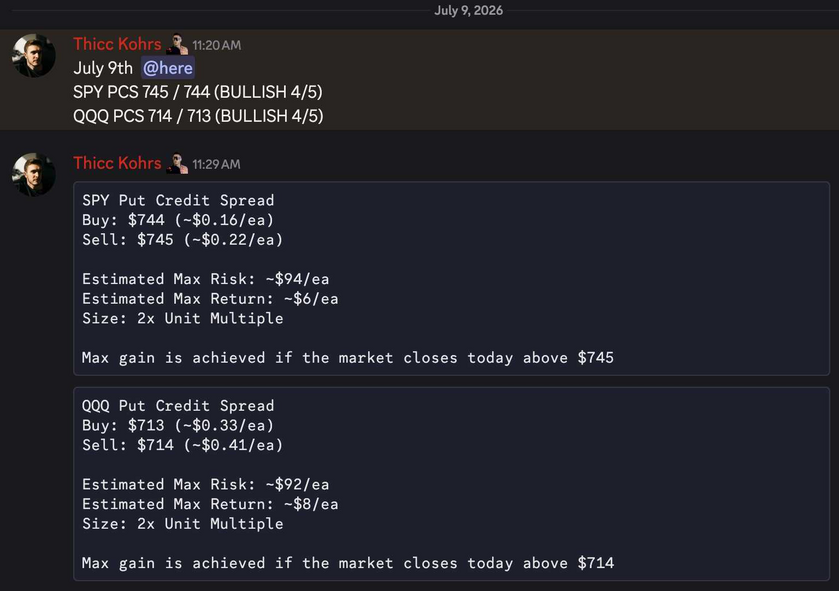 Both of these trades missed.Both of these trades hit if held until close -- 4 total units!

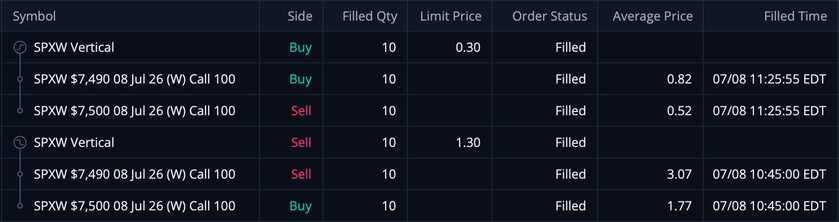 These CCS's were sold at $1.30/ea and were bought back at $0.30/ea -- THIS MEANS MY REALIZED GAIN WAS $1,000!!!