
March Sadness...
To Whom It Will Concern,
The bulls have no chill. The S&P 500, Nasdaq 100 & Dow 30 all hit a new all-time high. To all of you who have been degenerately bullish this entire time, a massive congrats to you!
The major development over the past week was the FOMC meeting. As expected, there was no change to the Fed Fund Rate. There will also most likely be no change at the May FOMC meeting. Currently, the next meeting that has decent odds of a cut is in June. It goes without saying that the major macroeconomic data reports between now and then will have a huge influence.
You might be thinking “why did the market pump higher when the expected thing happened?” The answer to that is twofold. First, the announcement removed uncertainty from the system. Even though there were extremely high odds there would be no change, it wasn't guaranteed. Second, the Summary of Economic Projections (SEP) was better than expected. The SEP highlighted the fact that most voting Fed members are more optimistic about our current situation than previously stated.
As we move forward, my plan is to continue to trade with the trend. I personally think it's silly for active traders to buy into the concept of something being/looking/feeling overbought (or oversold). The trend is your friend for a reason -- it pays! I know it sounds extremely simplistic and rudimentary, but all my market research has supported the adage.
The key reports and announcements of the upcoming trading week are detailed below. Godspeed.
Live, Laugh, Toaster Bath,
Thicc Kohrs
P.S. The official Goonie Discord is live! (FREE Access w/ code GOONIE: https://bit.ly/GoonieGroup)
Market Events
Monday, Mar. 25th
10:00 AM ET New Home Sales (Feb)
Tuesday, Mar. 26th
08:30 AM ET Durable Goods Orders (MoM) (Feb)
10:00 AM ET CB Consumer Confidence (Mar)
Wednesday, Mar. 27th
10:30 AM ET Crude Oil Inventories
Thursday, Mar. 28th
08:30 AM ET GDP 2nd Revision (QoQ) (Q4)
08:30 AM ET Initial Jobless Claims
09:45 AM ET Chicago PMI (Mar)
10:00 AM ET Pending Home Sales (Feb)
10:00 AM ET Consumer Sentiment Final (Mar)
Friday, Mar. 29th
ALL DAY MARKET CLOSED (Good Friday)
08:30 AM ET PCE Price Index (YoY)
08:30 AM ET PCE Price Index (MoM)
08:30 AM ET Personal Income
08:30 AM ET Personal Spending
11:30 AM ET Fed Chair Powell Speaks
Upcoming Earnings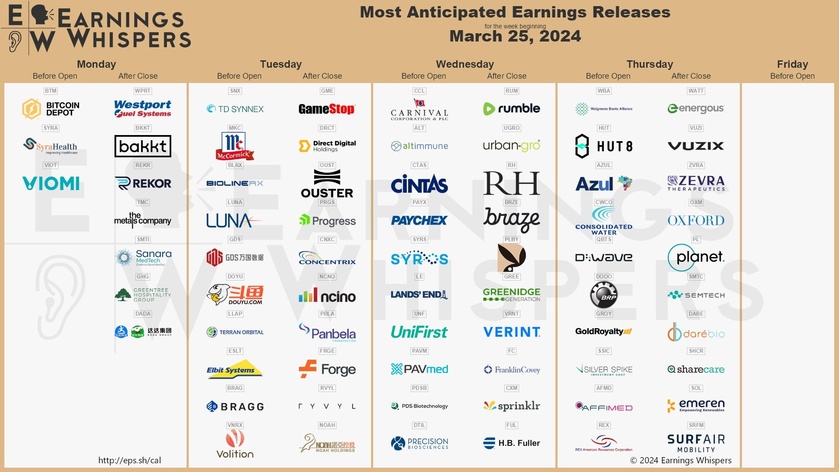
Monday
AM: Bitcoin Depot
PM: Bakkt
Tuesday
AM: McCormick
PM: GameStop
Wednesday
AM: Carnival
PM: Playboy & Rumble
Thursday
AM: Hut 8 & Walgreens
Friday
None
Seasonality Update
S&P 500 Seasonal Bias (Monday, Mar. 25th)
- Bull Win Percentage: 44%
- Profit Factor: 1.37
- Bias: Neutral
Equity Curve -->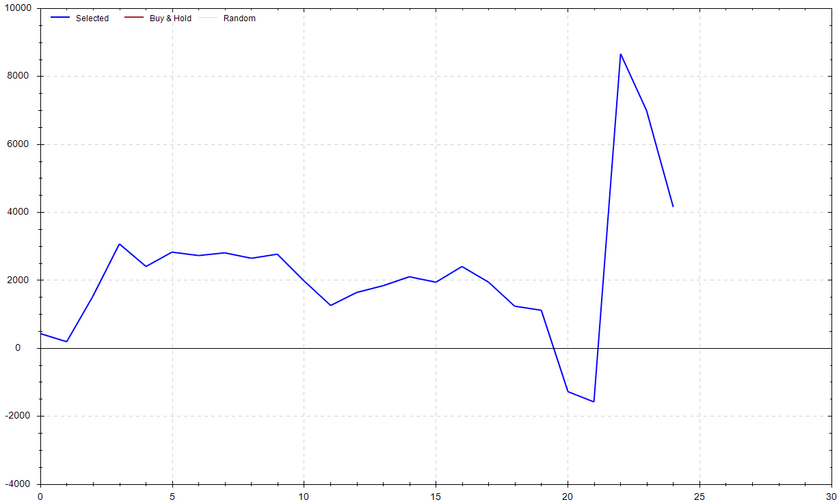
S&P 500 Seasonal Bias (Tuesday, Mar. 26th)
- Bull Win Percentage: 64%
- Profit Factor: 2.83
- Bias: Bullish
Equity Curve -->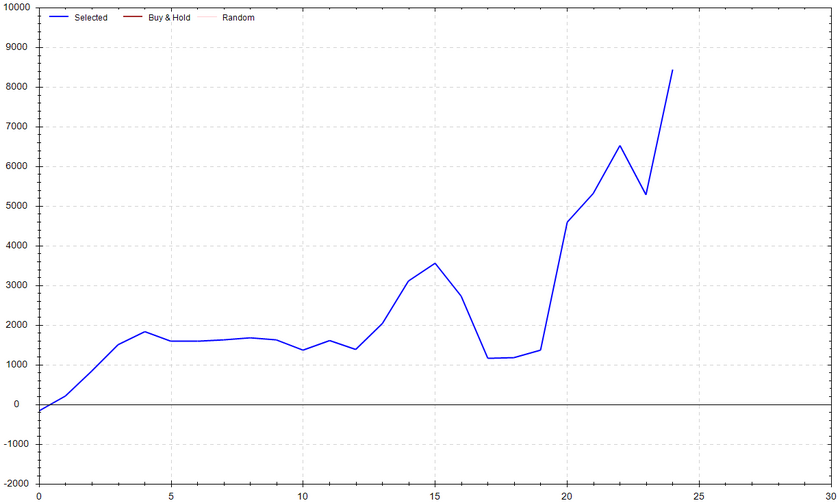
S&P 500 Seasonal Bias (Wednesday, Mar. 27th)
- Bull Win Percentage: 44%
- Profit Factor: 2.27
- Bias: Leaning Bullish
Equity Curve -->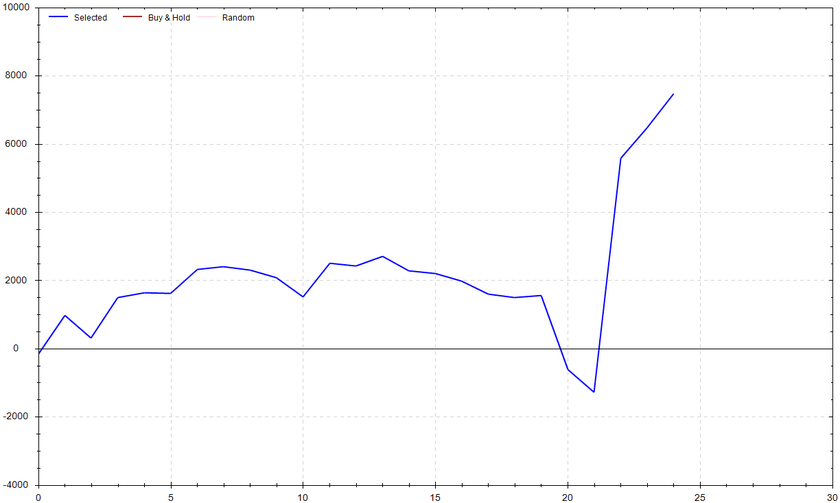
S&P 500 Seasonal Bias (Thursday, Mar. 28th)
- Bull Win Percentage: 44%
- Profit Factor: 0.75
- Bias: Bearish
Equity Curve -->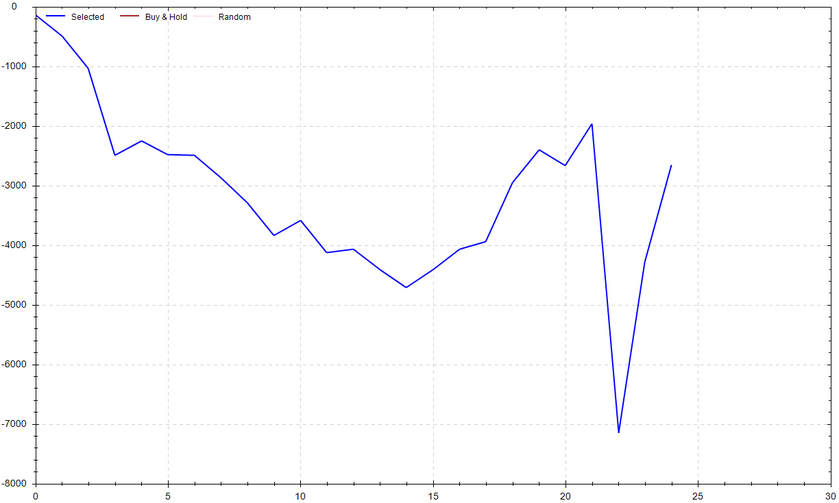
S&P 500 Seasonal Bias (Friday, Mar. 29th)
- Bull Win Percentage: 72%
- Profit Factor: 9.44
- Bias: Very Bullish
Equity Curve -->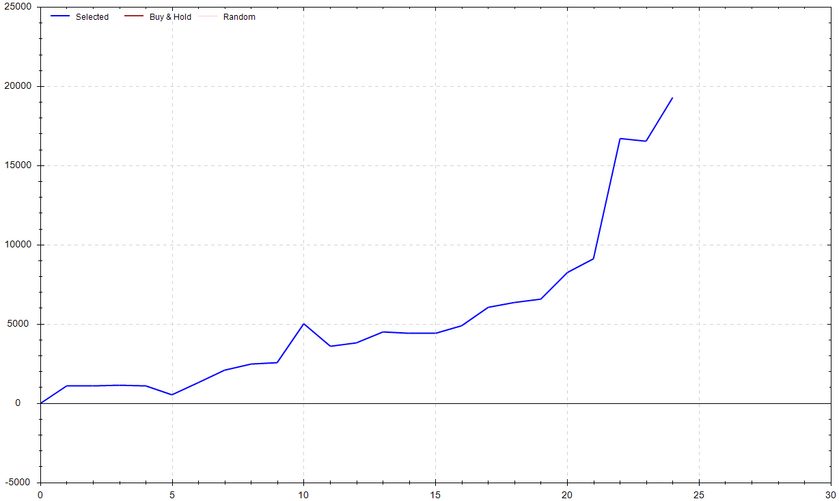
Notes: These analytics are derived from the performance of the S&P 500 futures contract over the past 25 years. Additionally, results are computed from the futures market open and close.
Options Strategy Update
The 0 DTE signal hit 5 for 9 times (12 for 20 total units) this past week.
Signal Accuracy: ~55%
This past week was Piper's worst performance YTD. The system is expected to have an accuracy of ~80%. Clearly, the signal underperformed expectations. This issue could be due to abnormal price action prompted by the FOMC meetin -- It also could have simply been "unlucky". I'll run some extra tests to ensure the model is still stable. If updates are necessary, I'll make them ASAP and keep you posted.
Piper's Current Signal Streak: 2 Trades
March Record: 54/68 Units
Monday Mar. 18th
SPY Put Credit Spread (2x Multiple @ $513 / $512) 🟢
QQQ Put Credit Spread (2x Multiple @ $438 / $437) 🔴
Tuesday Mar. 19th
SPY Call Credit Spread (2x Multiple @ $514 / $515) 🔴
QQQ Call Credit Spread (2x Multiple @ $438 / $439) 🔴
Wednesday Mar. 20th
SPY Put Credit Spread (2x Multiple @ $513 / $512) 🟢
Thursday Mar. 21st
SPY Put Credit Spread (2x Multiple @ $522 / $521) 🟢
QQQ Put Credit Spread (2x Multiple @ $447 / $446) 🔴
Friday Mar. 22nd
SPY Call Credit Spread (3x Multiple @ $524 / $525) 🟢
QQQ Call Credit Spread (3x Multiple @ $447 / $448) 🟢
Top 7 Charts of Interest
Bitcoin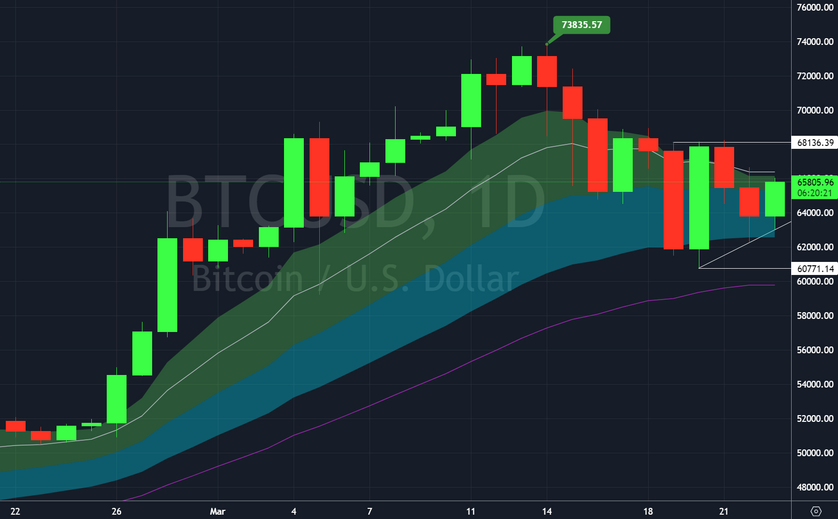
After a sizeable rip that was followed by consolidation, BTC is looking like it's gearing up for another pump. A close above $68k could serve as a nice entry trigger. A close below $61k would invalidate the setup.
Coinbase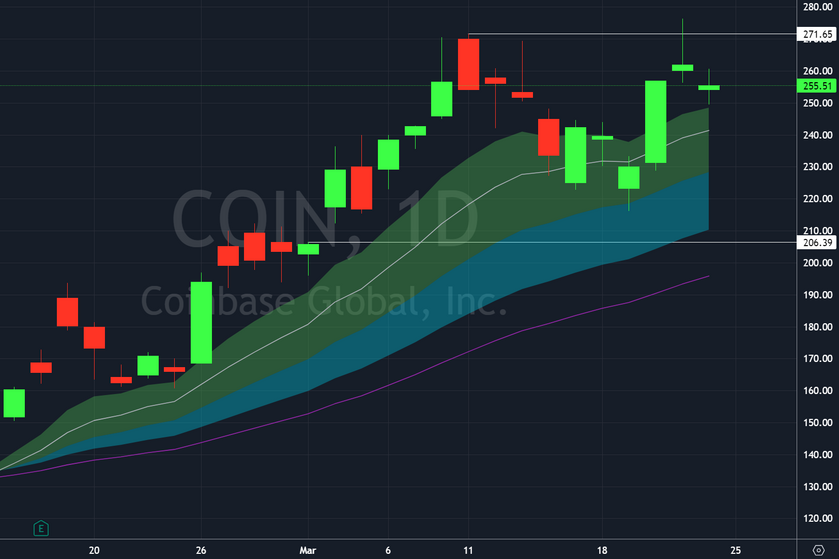
For obvious reasons, there is a good chance COIN will be correlated with BTC. The higher highs and higher lows suggest that the bulls are in control. A close above $272 could be an entry trigger. A daily close below $220 would invalidate the setup.
Nvidia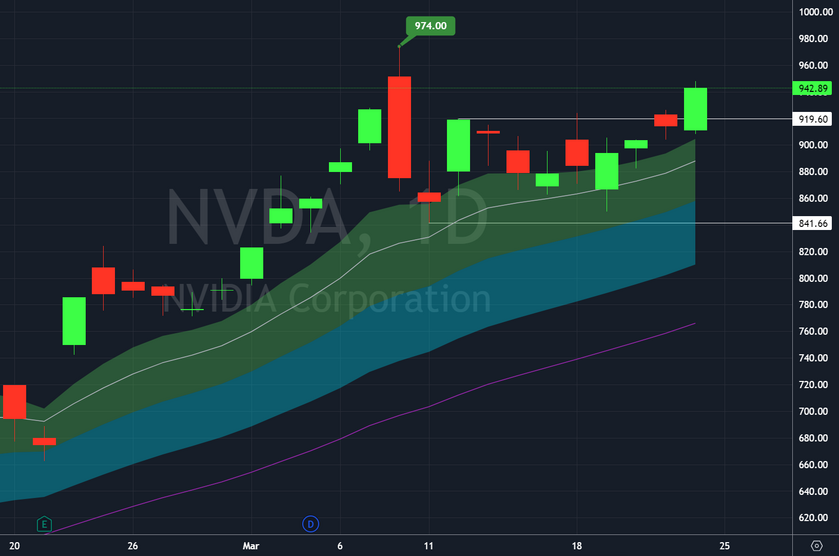
A bullish breakout doesn't get more obvious than the current NVDA chart. I have been calling out the $920 entry trigger for two weeks now. We could see some serious fireworks above $974. This setup would be invalidated below $850.
Meta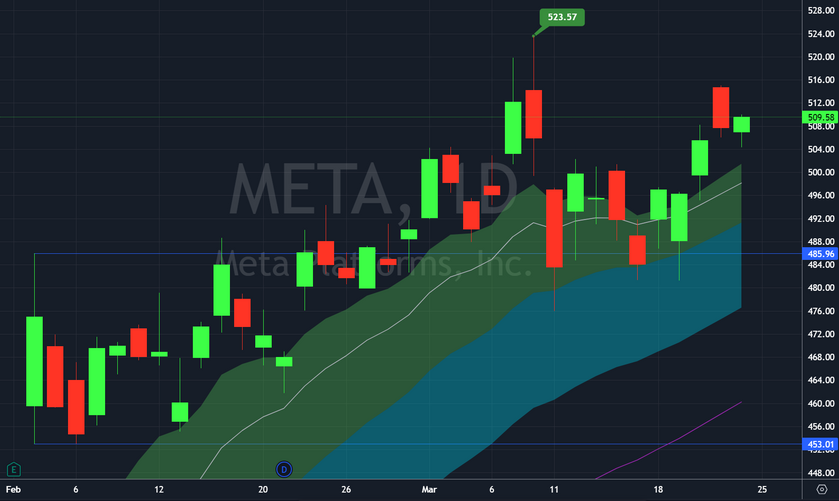
After a fake out breakout, META appears to be getting ready for a second attempt. The daily close above $500 was the entry trigger as discussed on stream multiple times. The structure would be invalidated by a daily close below $480.
Netflix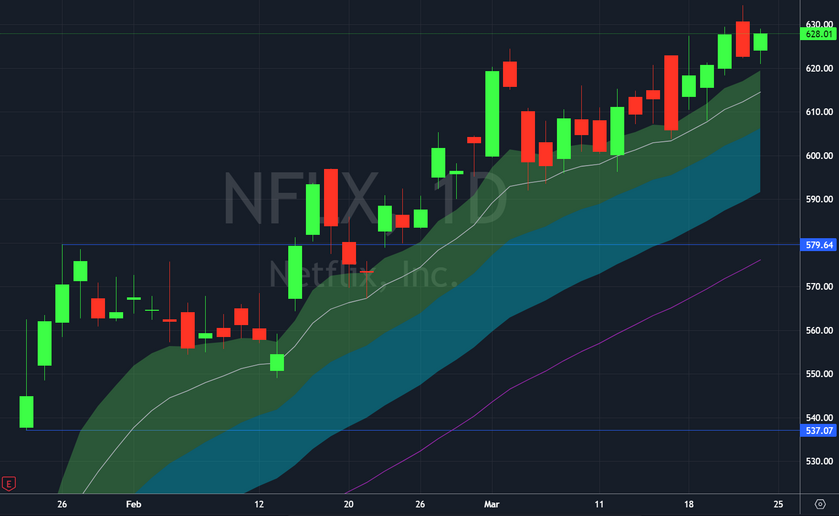
NFLX is continuing to grind higher & higher. Congrats to everyone who caught this fish when it was first called out weeks ago.
Amazon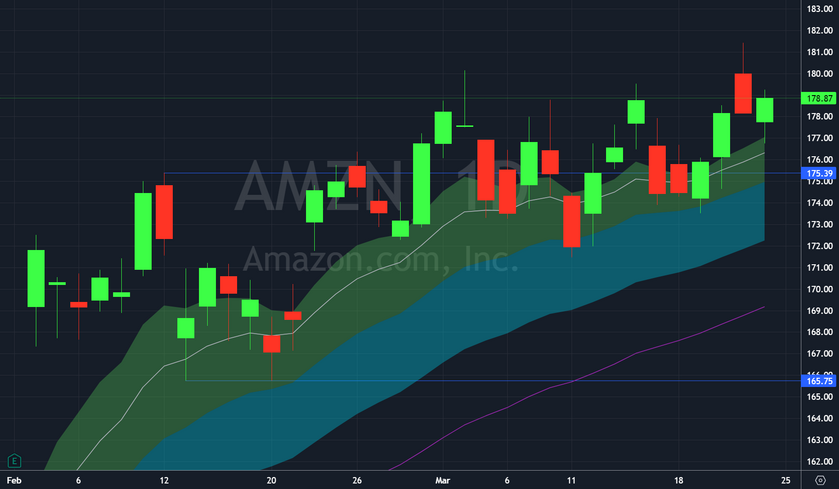
AMZN attempted to breakout from its earnings range twice. Both times it was swiftly rejected. I'm watching this chart closely to see if the third time is the charm. A close below $173 would invalidate the setup.
Apple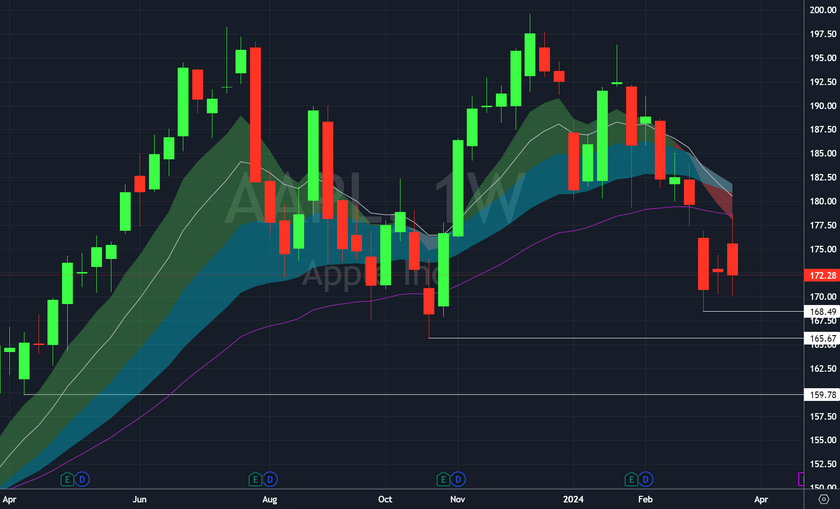
AAPL is getting destroyed. For various reasons, Apple is running into serious headwinds. If the chart can't hold the $166-$168 region, I'd be looking for additional downside to $160.
Total Mental Breakdowns While on The Stair Stepper
3.7 *
* This data point is from readings over the past week. The reported information should not be taken as an aggregate or cumulative value for any period beyond the most recent week (Sunday through Saturday). Appropriate alterations were made to account for both travel and time zone shifts.
Notes
RISK WARNING: Trading involves HIGH RISK and YOU CAN LOSE a lot of money. Do not risk any money you cannot afford to lose. Trading is not suitable for all investors. We are not registered investment advisors. We do not provide trading or investment advice. We provide research and education through the issuance of statistical information containing no expression of opinion as to the investment merits of a particular security. Information contained herein should not be considered a solicitation to buy or sell any security or engage in a particular investment strategy. Past performance is not necessarily indicative of future results. Links above include affiliate commission or referrals. I'm part of an affiliate network and I receive compensation from partnering websites.


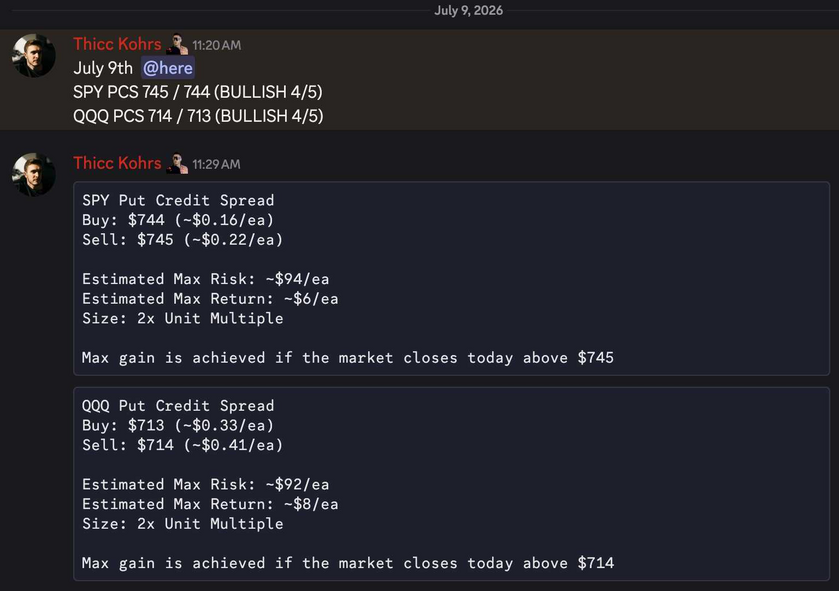 Both of these trades missed.Both of these trades hit if held until close -- 4 total units!

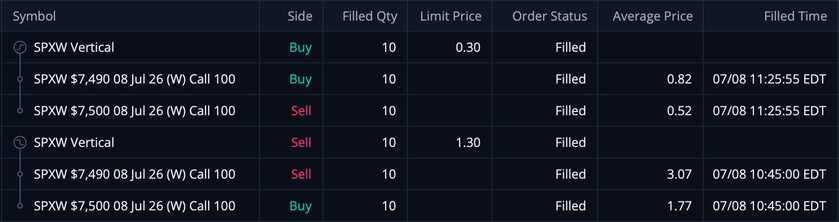 These CCS's were sold at $1.30/ea and were bought back at $0.30/ea -- THIS MEANS MY REALIZED GAIN WAS $1,000!!!